Article
Canadian Office Markets Stabilize Further in the Second Quarter
July 5, 2024 4 Minute Read

In a world of seemingly constant change and upheaval, stability has never been sexier.
Stable aptly describes Canadian office markets in the second quarter of 2024, with overall office vacancy holding at 18.5% nationally and the number of markets seeing improved downtown conditions continuing to grow.
Seven Canadian cities recorded either stable or declining office vacancy in Q2, according to CBRE’s just released Q2 2024 Canada Office Figures. Only London, ON, Waterloo Region and Halifax saw vacancy tick up, albeit slightly. Notably, Toronto has joined the national stabilization trend; downtown office vacancy in Canada’s largest market has remained at 18.1% for two consecutive quarters after steadily rising since Q2 2020.
The second quarter was also notable for the strong performance of downtown Class A office space, with vacancy in that segment decreasing for the second consecutive quarter. Six of the 10 Canadian markets tracked experienced declining downtown Class A vacancy in Q2.
Meanwhile trophy assets, the top tier within the Class A segment, had vacancy decrease by a remarkable 90 bps as two fully leased National Bank towers were added to inventory in Montreal and 160 Front St. West in downtown Toronto was also fully leased upon completion.
Widening Gulf
The gulf between vacancy in Class A and B/C buildings has continued to widen across the country with the national averages differing by 850 bps.
Sublet space has declined for a fourth consecutive quarter and currently sits at 15.0 million sq. ft., the lowest level of sublease space nationally in nearly two years, equal to 3.0% of existing inventory. Looking ahead, however, office projects expected to be complete in the latter half of 2024 are only 39.5% pre-leased and, should this remain unchanged, could cause the national vacancy rate to increase by 20 bps.
The second quarter saw 2.2 million sq. ft. of positive net absorption recorded nationwide, mostly due to the delivery of significantly pre-leased new office supply in the downtowns of Toronto and Montreal. Eight of the 10 Canadian markets tracked posted positive absorption of office space.

Early Stages of Recovery
“This is what the early stages of a recovery look like although it is still not broad-based,” says CBRE Canada Chairman Paul Morassutti. “Quality office space continues to reap most of the benefits from improving demand, which puts pressure on landlords with commodity space to make significant capital improvements and retrofits to increase the long-term appeal of their assets.”
Office construction has fallen to 5.7 million sq. ft., its lowest level since 2005. Toronto and Vancouver are the only markets with more than 1.0 million sq. ft. under construction.
Office conversions continue to move forward, with 929,000 sq. ft. coming out of competitive inventory in the second quarter as 10 projects commenced across five markets. The removal of this space had a minimal impact on reducing national office vacancy. Year-to-date conversions in 2024 have only aided in reducing vacancy by 10 bps. Office-to-residential conversion projects continue to comprise most of the activity (60.5%).
Industrial Availability Climbs
The national industrial real estate availability rate climbed further in Q2, rising at the same pace as last quarter and increasing 50 bps quarter-over-quarter to average 4.2%, according to CBRE’s Q2 2024 Canada Industrial Figures. This brings the national availability rate to its highest level since 2017 and approaches the 15-year historical average rate of 4.6%. All markets recorded increases in industrial availability in Q2.
Sublease industrial space has been a significant driver of higher availability in Canada, steadily rising for nine consecutive quarters to total 13.8 million sq. ft. in Q2. This pushed the national sublet availability rate up to 0.7%.
Industrial Demand Pullback
National net industrial absorption totaled -5.0 million sq. ft. in the second quarter, marking the first meaningful return of industrial space to the market in nearly 15 years. The negative net leasing activity in Q2 was led by Toronto, which reported -3.7 million sq. ft. of net absorption. Net leasing activity in the quarter was strongest in Calgary, with 385,000 sq. ft. of positive net absorption, driven primarily by the delivery of pre-leased new supply.
The national industrial construction pipeline increased in the second quarter to a total 33.4 million sq. ft., or 1.7% of national inventory. The second quarter saw 4.5 million sq. ft. of new projects kick off, predominately speculative facilities in Toronto, which accounted for 74.4% of new construction starts in Q2. Speculative projects make up 74.9% of the total national space under construction.
New industrial supply completions in Q2 fell substantially from the pace of recent quarters, with just 3.9 million sq. ft. of space delivered, much of it in Toronto, Montreal and Calgary.
“The shift in industrial momentum has been quick, but companies have a reasonable number of options to move around and grow, which is what you want to see in a healthy marketplace,” says Morassutti, noting that 23.5 million sq. ft. of space is expected to be delivered in the second half of 2024.
Recent Insights
-
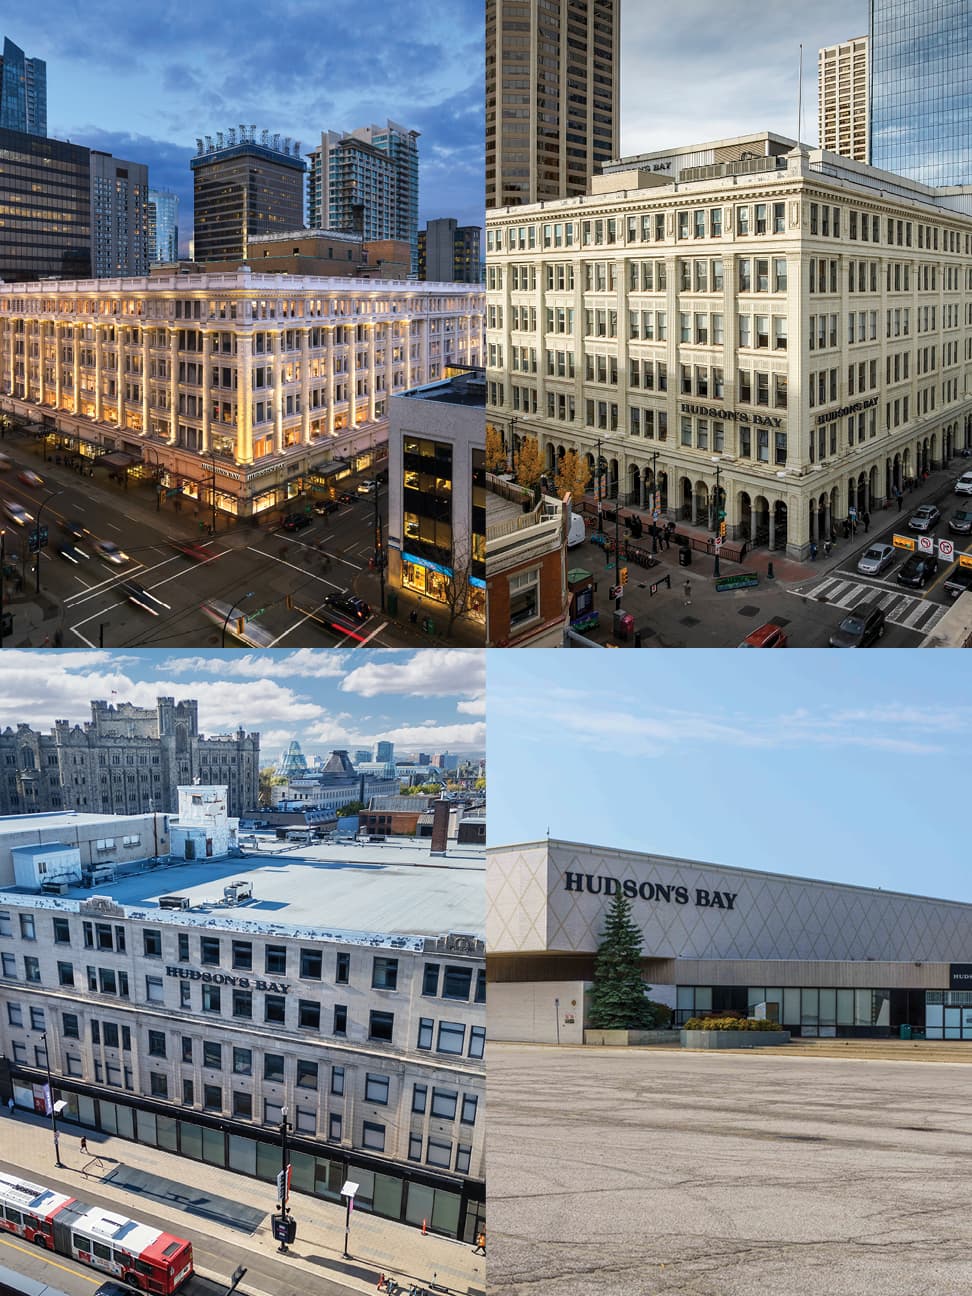
Former Hudson’s Bay Co. buildings in Vancouver, Calgary, Ottawa, and Windsor, ON have new owners thanks to the efforts of CBRE’s National Investment Team.
-
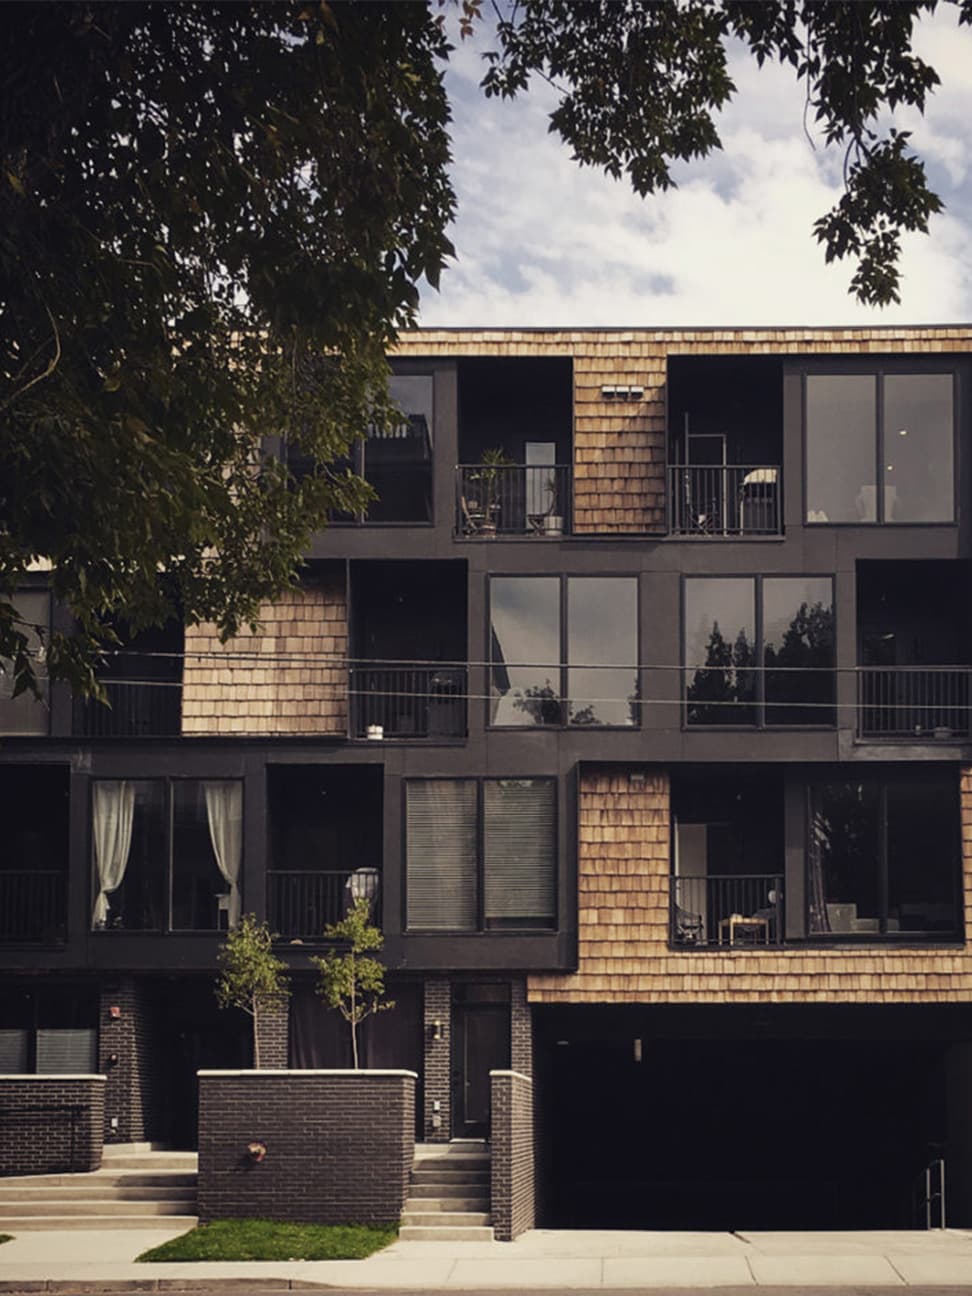
CBRE facilitated the sale and financing of SWITCHbloc, a 19-unit apartment property in Calgary’s Lower Mount Royal neighbourhood.
-

CBRE is looking for Saskatoon’s first downtown grocery store at a major new mixed-use redevelopment at the former Star Phoenix site.
Stay In The Know
Subscribe today and join hundreds of professionals who get the latest blogs delivered straight to their inbox.