Figure
Canada Office Figures Q3 2026
October 1, 2026
Canadian office market accelerates, as the spread between product tiers reaches new highs
Executive Summary
- National office momentum remained positive in Q3 2026, totalling 2.0 million sq. ft. Nine of 11 markets posted gains, with an increasing number of cities reporting back-to-back quarters of positive net absorption.
- Vacancy spreads between premium and lower-tier properties have hit a historic high downtown amid the broader office market recovery. Suburban vacancy meanwhile reported its largest quarterly decline since Q1 2020.
- Sublease space fell by 1.3 million sq. ft. in Q3, the largest single-quarter drop since 2005, as sublets either expired or were leased/retained by existing tenants. Significant decreases were noted in Toronto, Calgary, and Montreal, a positive indicator of improved occupier sentiment.
- Construction activity has increased, a first in four years, thanks to two suburban starts. Despite this, the pipeline remains near historic lows with forecasted annual new supply on track to be outpaced by conversions/demolitions.
- Conversions/demolitions have remained active with a growing share of office-to-hotel projects. Improving leasing sentiment, however, has prompted some owners to reassess current market opportunities before redeveloping.
Momentum continues with a growing share of markets seeing net absorption build
National office market momentum remained positive for a fifth consecutive quarter in Q3 2026 with 2.0 million sq. ft. of net absorption.
Nine of 11 markets saw positive net absorption this quarter, with over 500,000 sq. ft. being recorded once again in each of Toronto, Calgary and Montreal.
A growing share of markets are seeing consecutive quarters of positive absorption. Calgary’s momentum has continued to build over the last three quarters and was joined by Montreal, where the last large block of AAA space was leased this quarter alongside other healthy activity in the suburbs.
Strong performance was also noted in Winnipeg this quarter; meanwhile, Ottawa and Edmonton have remained effectively neutral with new listings offsetting leasing activity.
Vancouver’s performance in Q3 was largely considered to be an outlier for the market, which was heavily influenced by the long-planned consolidation of space by a technology tenant. Excluding this movement, the market would have otherwise held stable.
Spread between product tiers at historic high
The recovery downtown is well underway, as illustrated by five quarters of declining vacancy. While improvement has been noted across product tiers in recent quarters, leasing activity was particularly elevated in Class A in Q3, which tightened vacancy by 60 bps.
The spread in vacancy across product tiers, both Class A vs B/C and Trophy vs B/C, is currently at historic high levels, highlighting that tenant preferences for high-quality space have never been more prevalent than at any other point in time.
The prioritization of best-in-class product has long been emphasised. Trophy vacancy is at a six-year low nationally, with Toronto and Montreal both reporting vacancy of 3.0% and below.
While it is expected that the increasingly competitive environment for premium space will result in demand spilling over to the next-best spaces, to date that has largely placed a focus on the broader A market. Class B/C assets meanwhile have stalled, with vacancy instead largely improving due to removals of obsolete inventory.
Vacancy improving by equal measure downtown and in the suburbs
Positive momentum has continued downtown and in the suburbs as both declined by 50 bps this quarter. This represents the largest quarterly decline for the suburban market since Q1 2020, which has proven to be particularly stable over the last five years.
Rising return-to-office expectations continue to fuel activity downtown and are resulting in a positive shift in leasing fundamentals as eight markets reported declining downtown vacancy in Q3 2026. Toronto (-90 bps) has continued to lead this trend, and was followed by Calgary (-80 bps), Ottawa (-80 bps) and Halifax (-70 bps).
Suburban market performance remains slightly more mixed, with seven of 11 markets reporting decreased vacancy. The largest quarterly improvements were noted in Winnipeg (-200 bps), London (-140 bps) and Montreal (-130 bps).
Sublease space declines by largest measure since 2005
National sublease space fell by 1.3 million sq. ft. in Q3 2026, representing the single largest quarterly market decline since 2005. Sublet space has reduced by a cumulative 8.7 million sq. ft. or 50.2% from its peak over three years ago, highlighting improved occupier sentiment.
National sublet space remains on par with 2018 levels and has now dropped below 9.0 million sq. ft. for the first time since Q2 2020.
Sublet activity this quarter was mainly attributed to three markets - Calgary (-540,000 sq. ft.), Toronto (-500,000 sq. ft.), and Montreal (-348,000 sq. ft.) – and was driven by a combination of lease expiries, transactions, and tenants retaining some of the largest sublet blocks of space. The remainder of the markets noted more negligible quarterly movements, all under +/- 80,000 sq. ft.
On a year-over-year basis, all markets but Ottawa are reporting lower sublease levels as a percent of inventory. A remarkable four of 11 markets, meanwhile, are down by over 100 bps including London (-140 bps), Toronto, Montreal (both -120 bps), and Waterloo Region (-110 bps).
Suburban construction pipeline grows with two new office starts
Two new suburban office projects commenced construction in Waterloo Region and Halifax this quarter. Amounting to 126,000 sq. ft., this is the first time in over two years in which more than one project has moved into active development in a given quarter.
Starts this quarter included the 80,000 sq. ft. Park Place VI in Halifax, which is the largest single project start since Q1 2024, and the 46,000 sq. ft. Phase 1 of 35 Bett Court in Waterloo Region.
No completions were noted in the third quarter; however, an additional 301,000 sq. ft. of new supply is anticipated for delivery across five markets in the final quarter of 2026. Full year new supply is forecast to reach just 2.3 million sq. ft., which is well below the recent five-year average.
Due to the smaller-scale nature of recent starts, the thinning pipeline of new supply is expected to remain constrained with no significant deliveries on the horizon beyond 2027.
Office construction total increases for the first time in four years
The national office construction pipeline has increased, albeit marginally, for the first time in four years. Currently totalling 1.4 million sq. ft., the overall pipeline remains just below the previous 22-year low.
Despite the lean level of construction, the total national office pipeline is presently only 23.2% pre-leased, with the market instead focused on existing product. Just one year ago, national pre-leasing amounted to over 60.0%.
Development activity has remained primarily suburban over the course of 2026. Very conservative levels of suburban development are underway with no more than four active projects in a single city.
Forecasted full year new supply is on track to be outpaced by conversion and demolition activity for a second consecutive year.
Share of office-to-hotel conversions grows
Conversions and demolitions continue to chip away at inventory, with seven projects noted this quarter across Toronto, London, and Ottawa.
Since 2021, conversions have removed a cumulative 9.6 million sq. ft. of office space from national inventory. An additional 3.0 million sq. ft. has been demolished over the same period. Together, they have reduced office inventory by 2.7%, rejuvenating properties and sites that otherwise faced potential obsolescence.
The share of office-to-hotel conversions has continued to rise, highlighted by two projects in Toronto this quarter: 69 Yonge Street and 95 Moatfield Drive. The cooling condo market has shifted some conversion activity to the hotel sector where new supply levels have been low in recent years. Paired with consistently high occupancy levels, these conversions are increasingly attractive.
Though conversions remain active, their inherent complexity, coupled with improving leasing sentiment, has prompted some owners to reassess current market opportunities before proceeding with redevelopment plans.
Local Market Insights
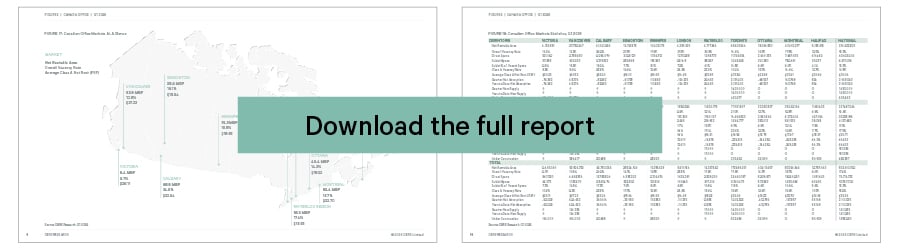
Explore regional office statistics in Victoria, Vancouver, Calgary, Edmonton, Winnipeg, London, Waterloo Region, Toronto, Ottawa, Montreal, and Halifax.
Want to receive future reports? | Sign up here.
Contacts



Stay in the Know
Stay up to date on relevant trends and the latest research.